Data Analytics & Python
SQL: Data Cleaning and Exploration


Exercises where I went through large data sets, formatted the data so that it was consistent and easier to manipulate, and ran multiple SQL queries to analyze the data.
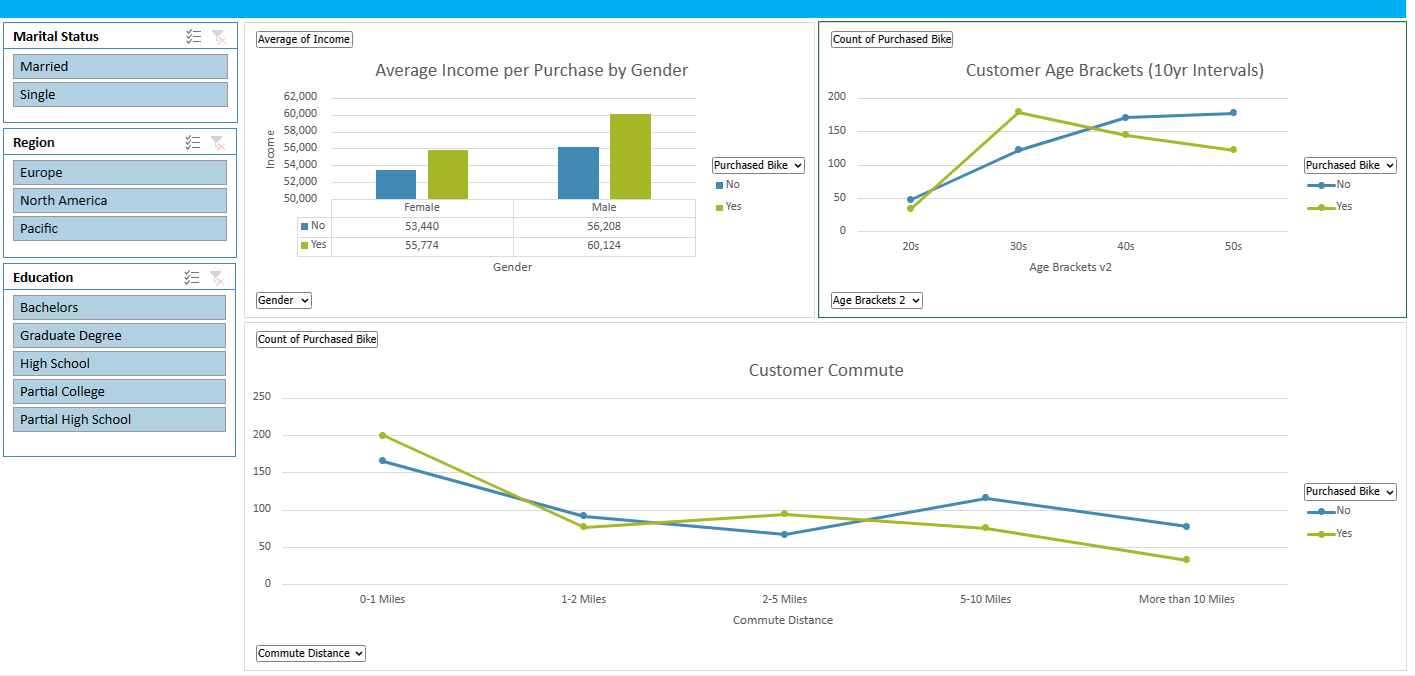
Data Visualization in Excel
Reformated the data in the Excel columns so that they were more readable. For example, changing 'M' and 'S' to 'Married' and 'Single' so that you don't have to guess what the single letters stand for. Used the information to create pivot tables and then used those pivot tables to create a dashboard with filters.
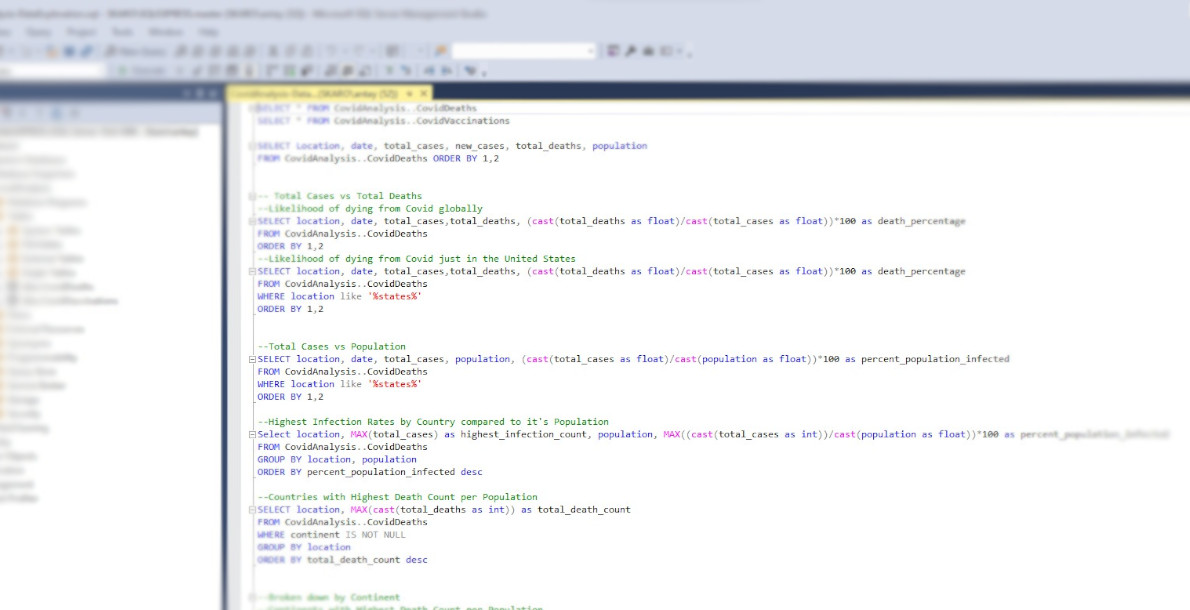
View ProjectSQL: Data Cleaning and Exploration
Used SQL to analyze Covid data. Looked at things like countries with the highest rates of infection per population, countries with the highest death count per population, and continents with the highest death count per population.
View Project
Python: BMI Calculator


Your standard body mass index (BMI) calculator written in Python. It'll prompt the user their name, weight in pounds, and height in inches, and then let you know what category you fall in.
View Project
Python: Automatic File Sorter
Input your file path and it will create a seperate folder for png, csv, and text files and then seperate those files into their respective folders.
View Project
Python Web Scraping: Amazon
Built a web scraper using Python in Jupyter Notebook that checks on a "Got Data?" t-shirt that is for sale on Amazon. It pulls the title, price, rating, and description information, formats the information to make it more readable, and logs the data in a csv file (creating the csv file if it doesn't already exist). I set it up to automatically pull the data once a day and append it to the csv file. There's also code to send an email if the t-shirt's price drops below $14.00.
View Project
Python: Crypto Currency API
Pulls information from a crypto currency API and stores it in a dataframe using Pandas and Python. Set it collect the data once every minute and then append the data to the dataframe. Then worked on cleaning the data and making it more readable and eventually putting the data into charts.
View Project